Cumulative Charts
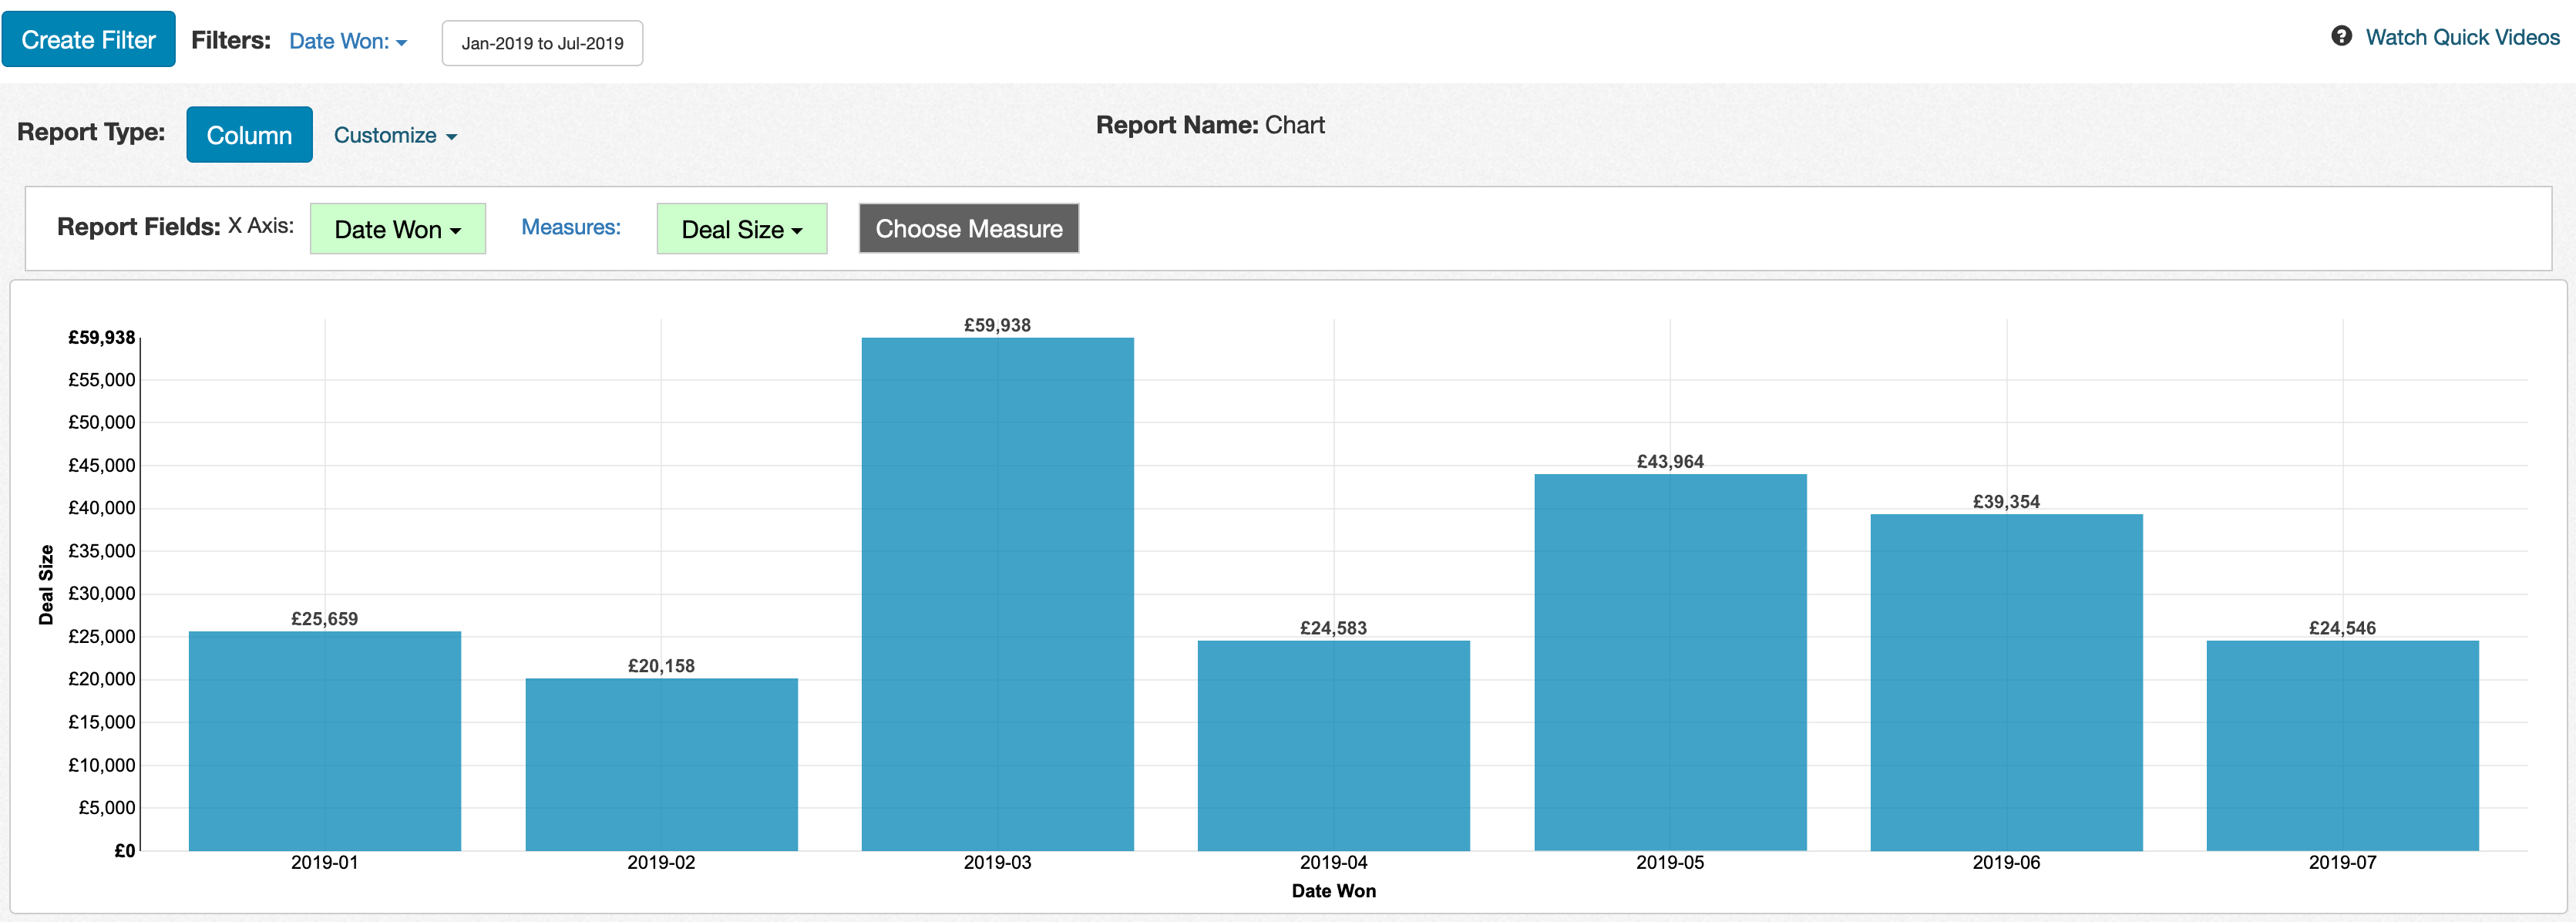
For column, bar, stacked column, and stacked bar charts, you can create a comparison to historical performance. For example, we could start with a column chart as shown below. The X axis of the chart is the Date Won field and the Y axis is Deal Size. The report has a range filter restricting the report to data from January to July of 2019. The image below shows the sample report before anything else is done:
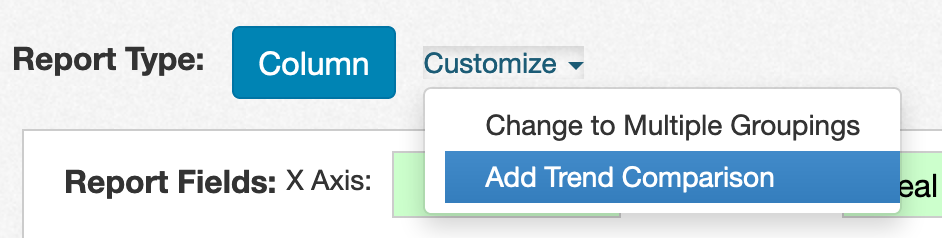
To create a comparison to historical trends, click on the 'Customize' link next to the report type button and choose 'Add Benchmark Comparison':
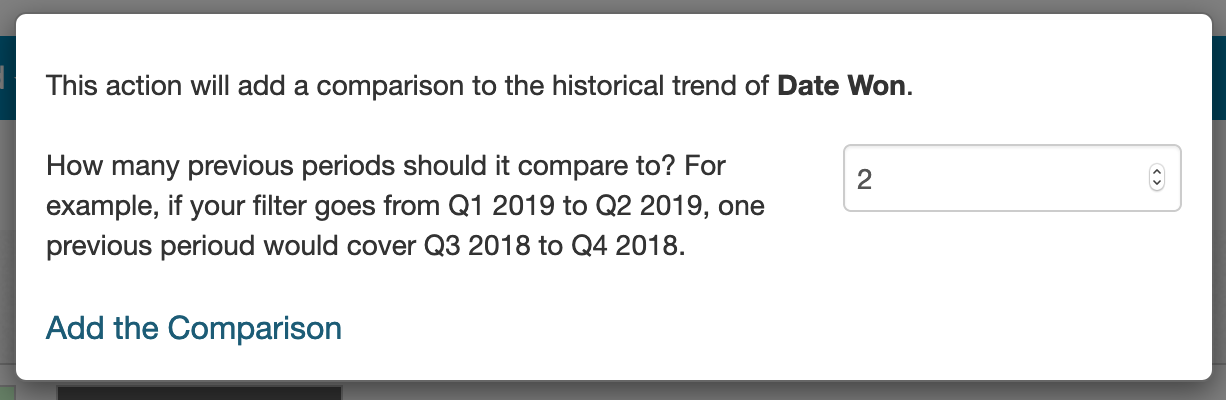
You can either create a comparison to all history or to a specific number of periods prior to the appropriate filter. For example, we can choose to compare to the two periods previous to our Date Won filter:
The result is a new column on the left side of the chart, showing the historical monthly average for the chart measure. The chart columns are colored green if above that monthly average and colored red is below that monthly average.
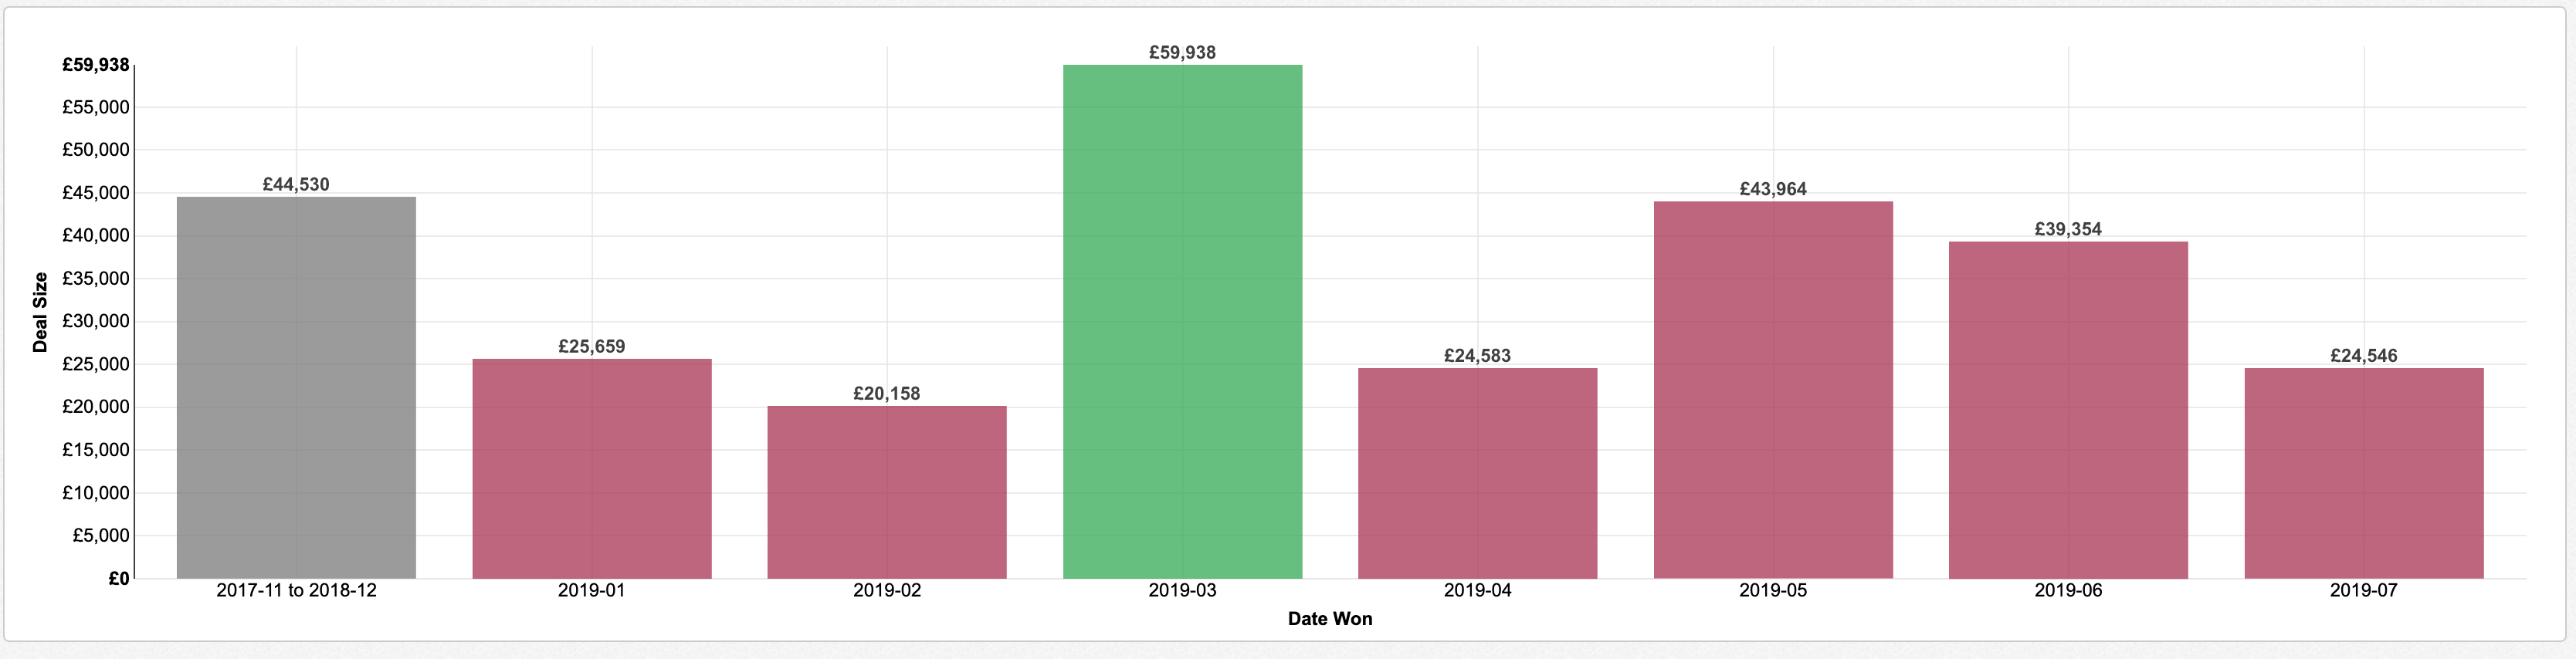
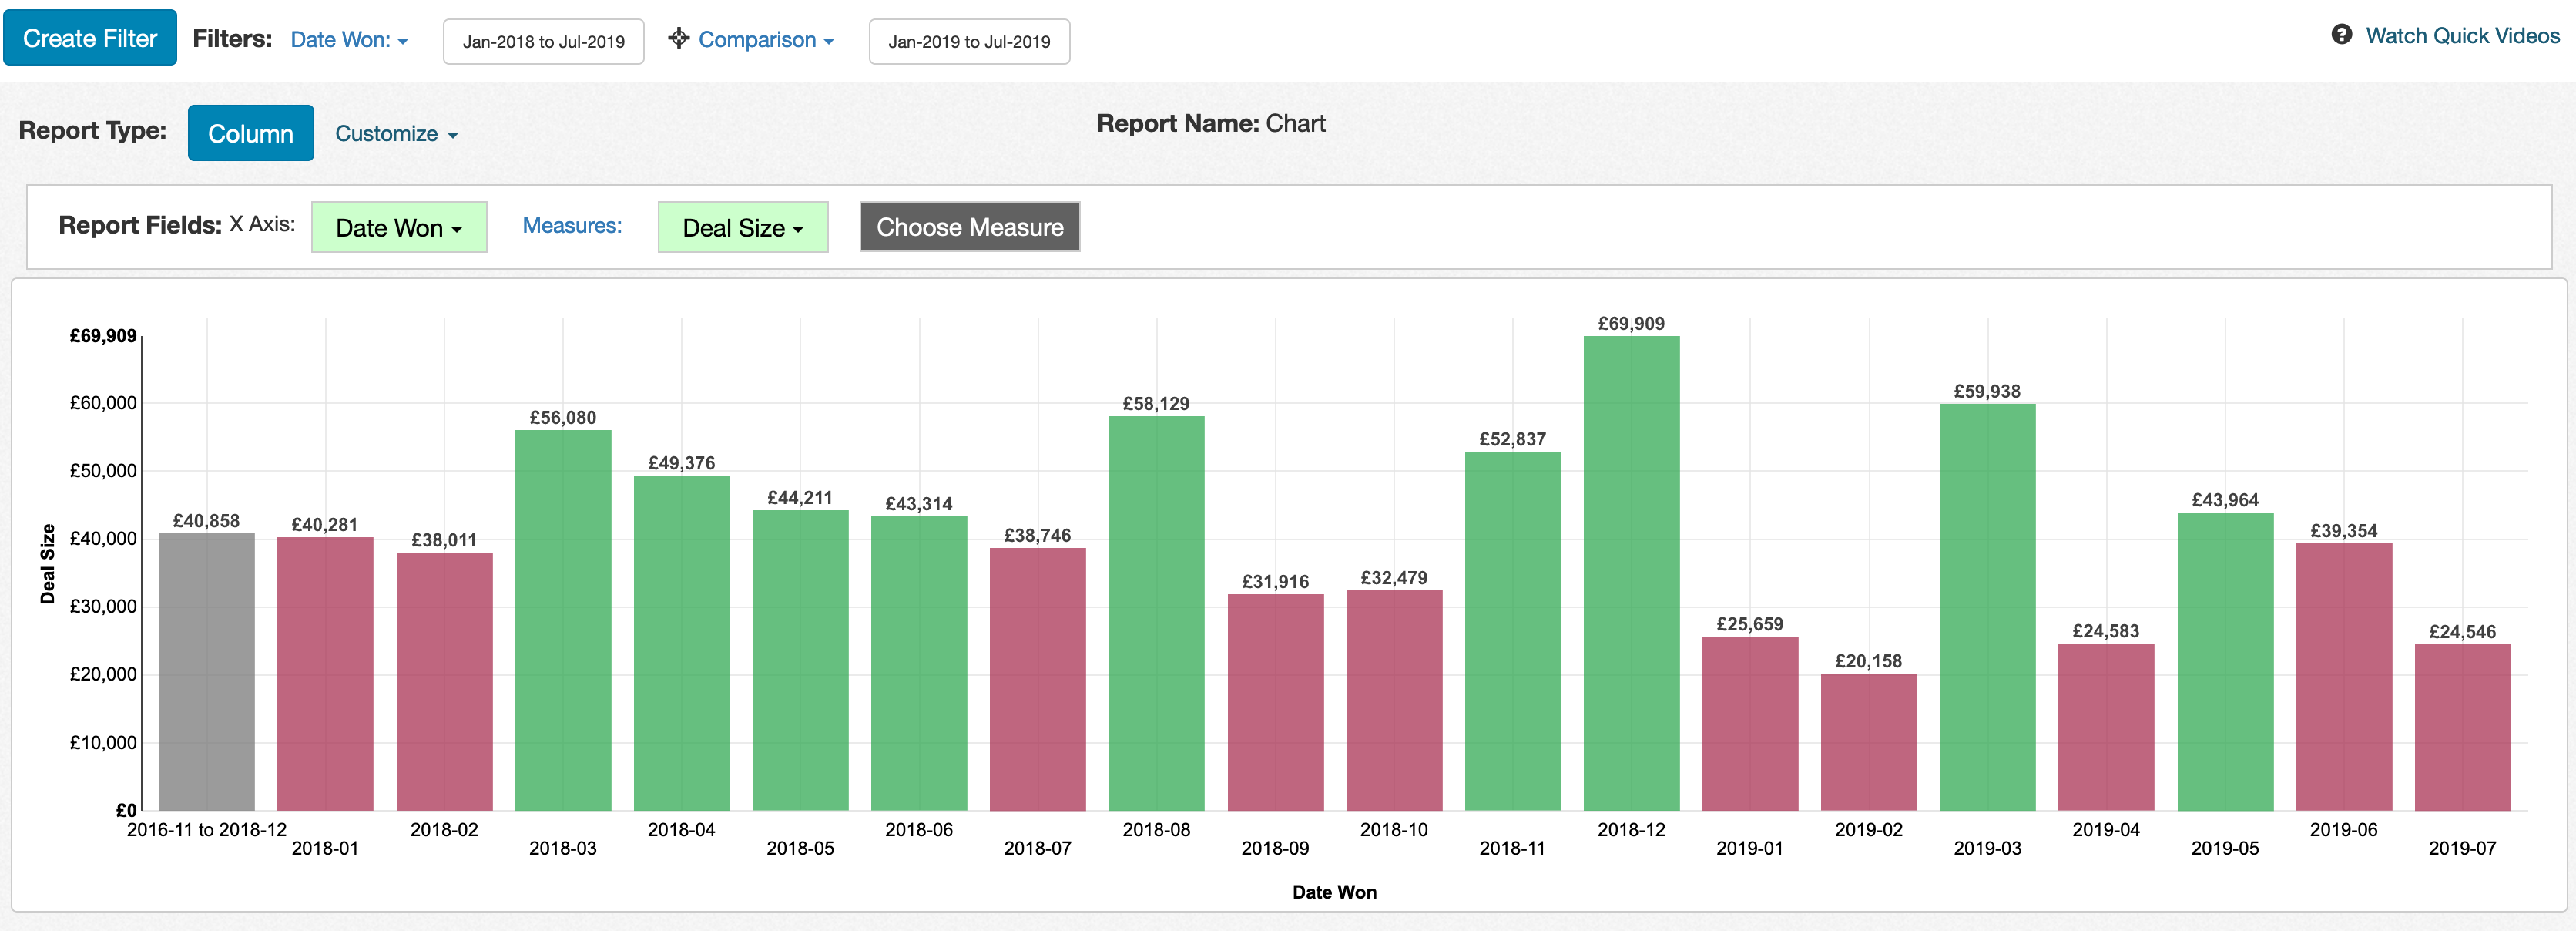
When the user adjusts the date filter, the comparison automatically updates to the appropriate comparison interval. For example, the image below shows what happens when we adjust the filter to go from January 2018 to July 2019:
If you want to customize the number of periods used for the comparison, you can edit the 'Previous' filter by clicking on the filter label and doing Edit Filter:
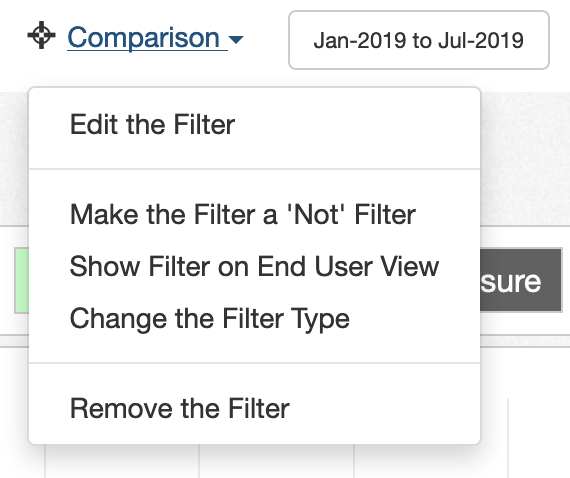
There is a row for 'Number of Previous Periods' in the filter edit window. You can adjust that number to your desired interval:

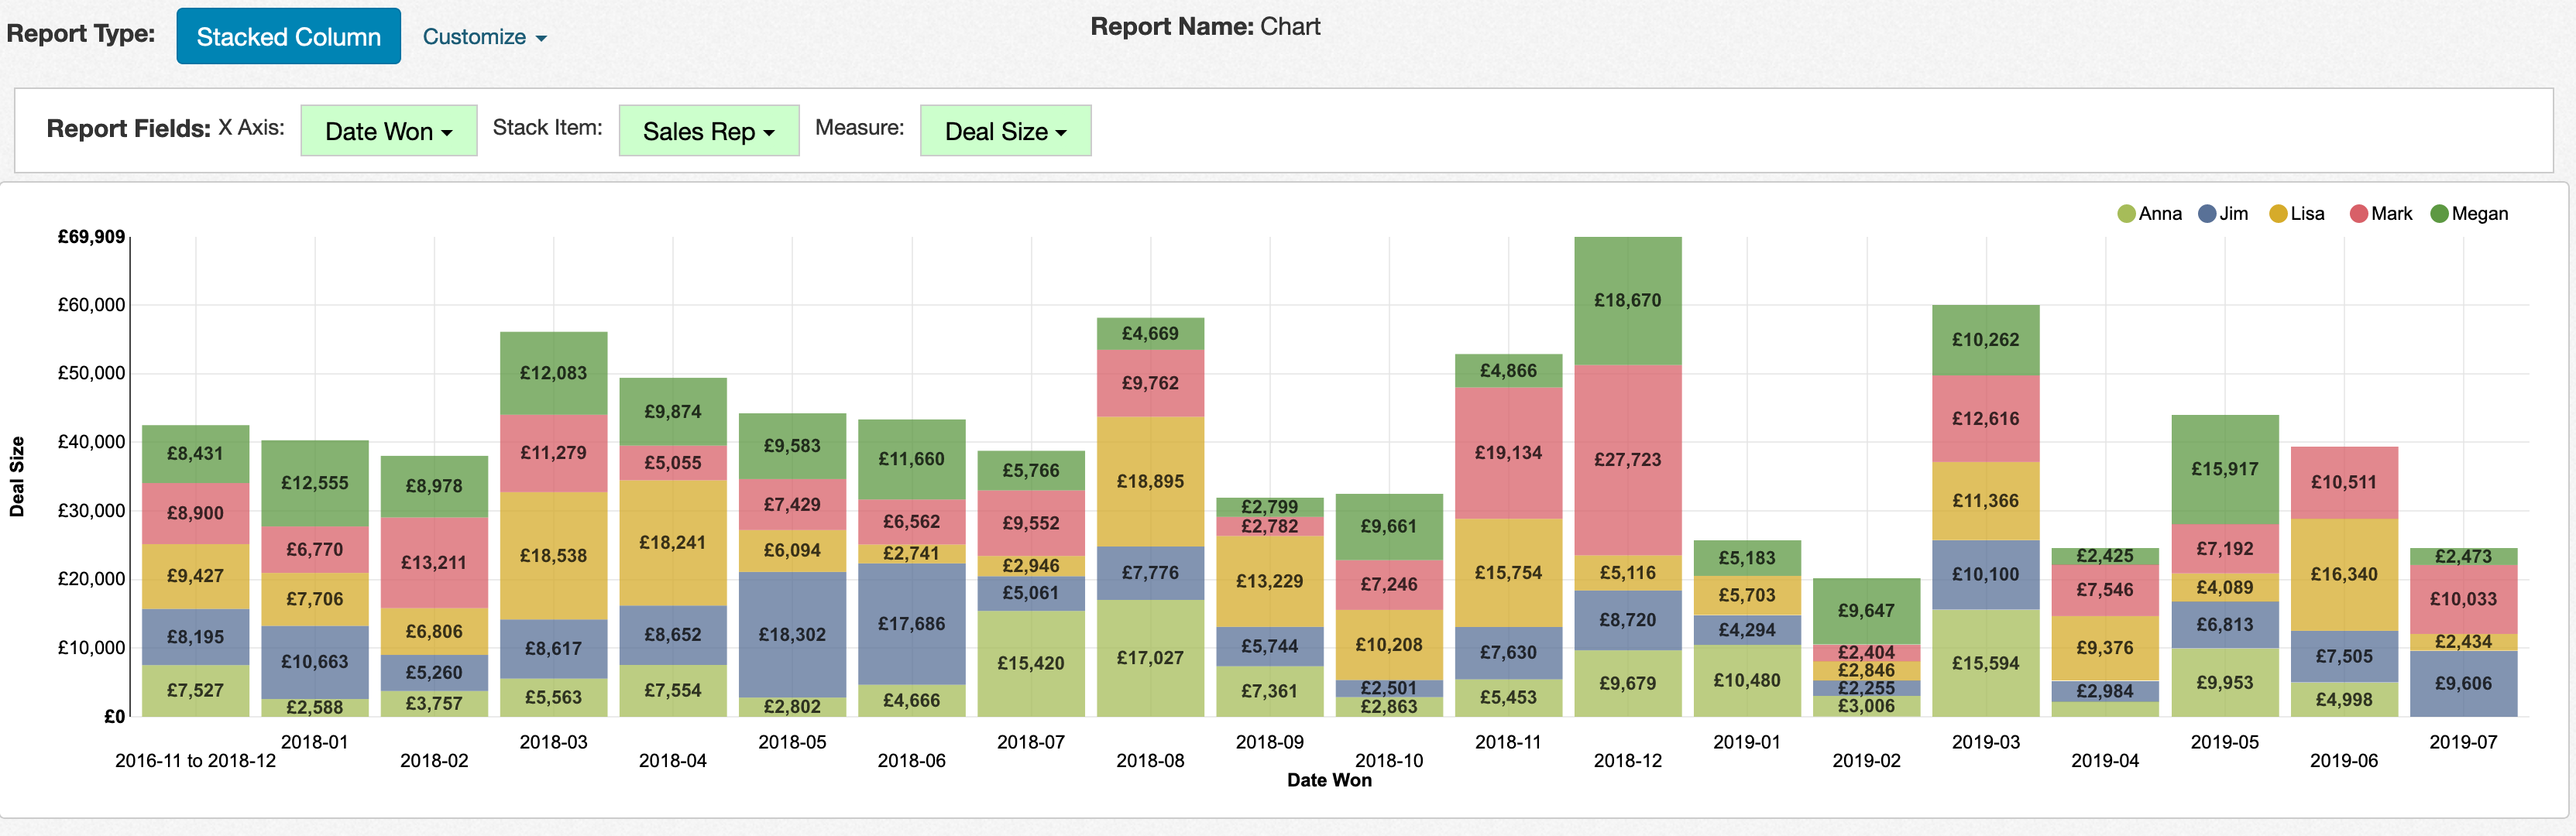
The previous period functionality works for rolling, range, and absolute date range filters. You can also apply this functionality to stacked column and stacked bar charts, though it won't include any custom highlighting: