
Conditional Formatting
Basic Conditional Formatting
Let's say you want to highlight values where the Current Stage is 'Closed - Won' as green. In the report editor, click on the "Configuration" menu in the report editor and choose "Conditional Formatting." Within the conditional formatting page, you would add the following expression:
if([Current Stage] == 'Closed - Won', colortext([Current Stage], "#008800"))When this formatting runs, the resulting report will color the bar as green as shown below:
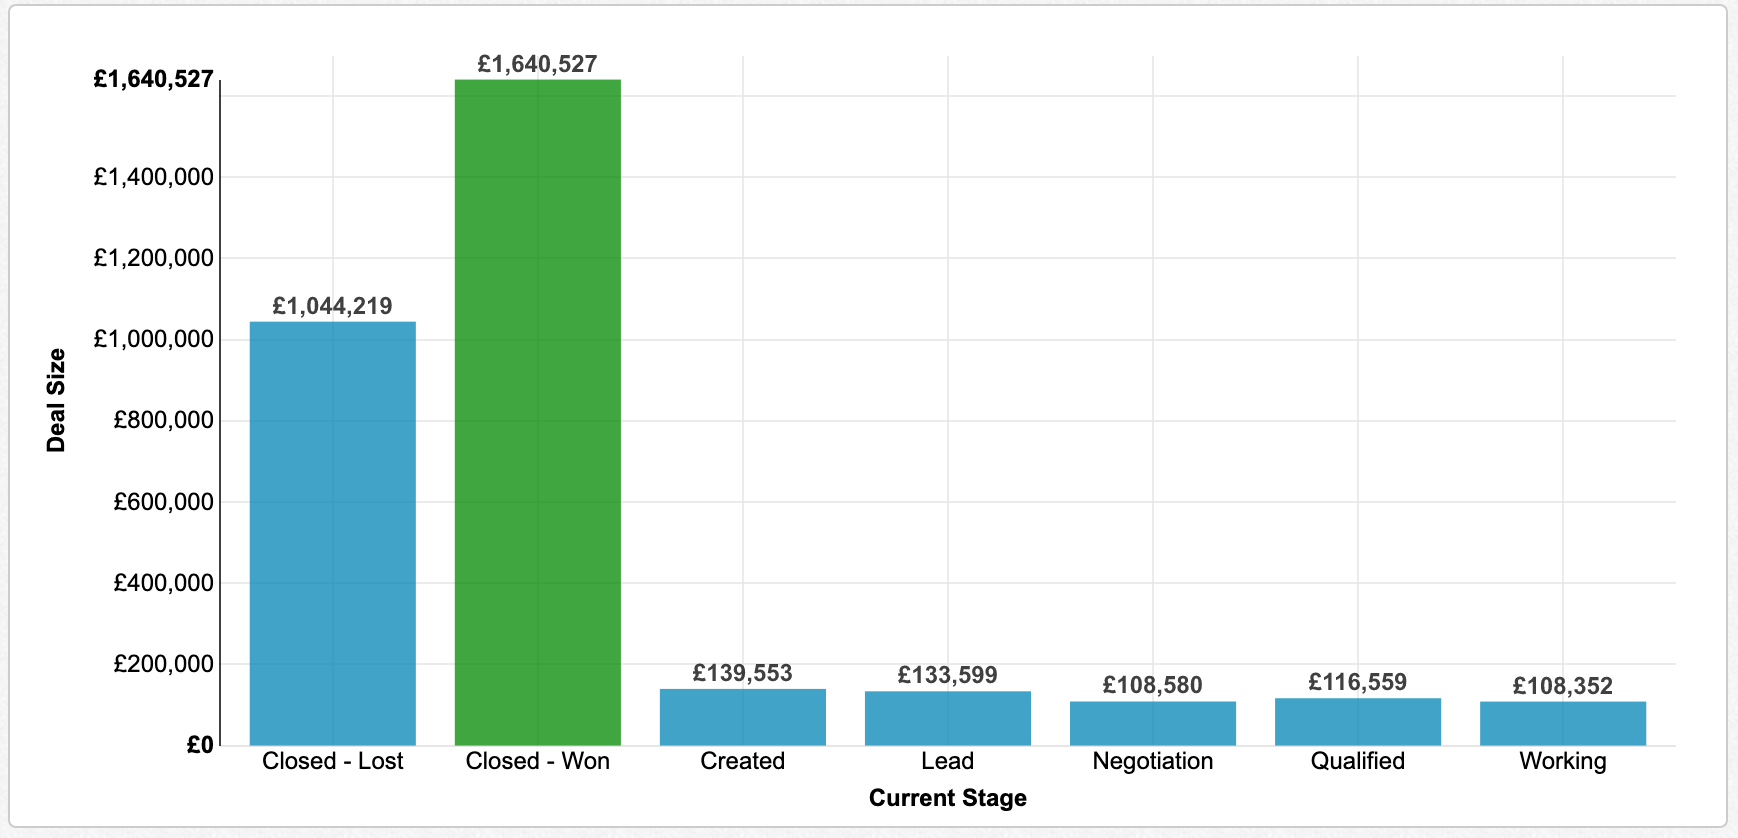
The colortext() function takes in the parameters of the field you wish to highlight and an HTML color code surrounded by double quotes. Similar functions are available for adjusting the background color:
if([Current Stage] == 'Closed - Won', backgroundcolor([Deal Size], "#008800"))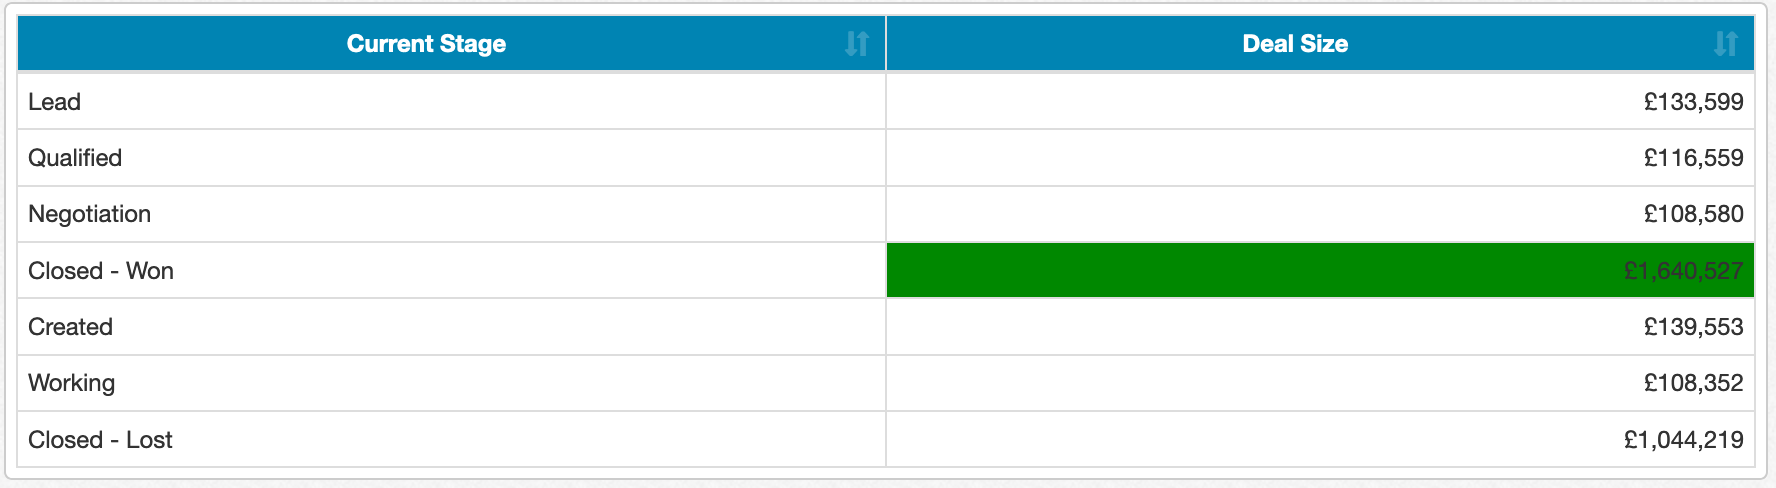
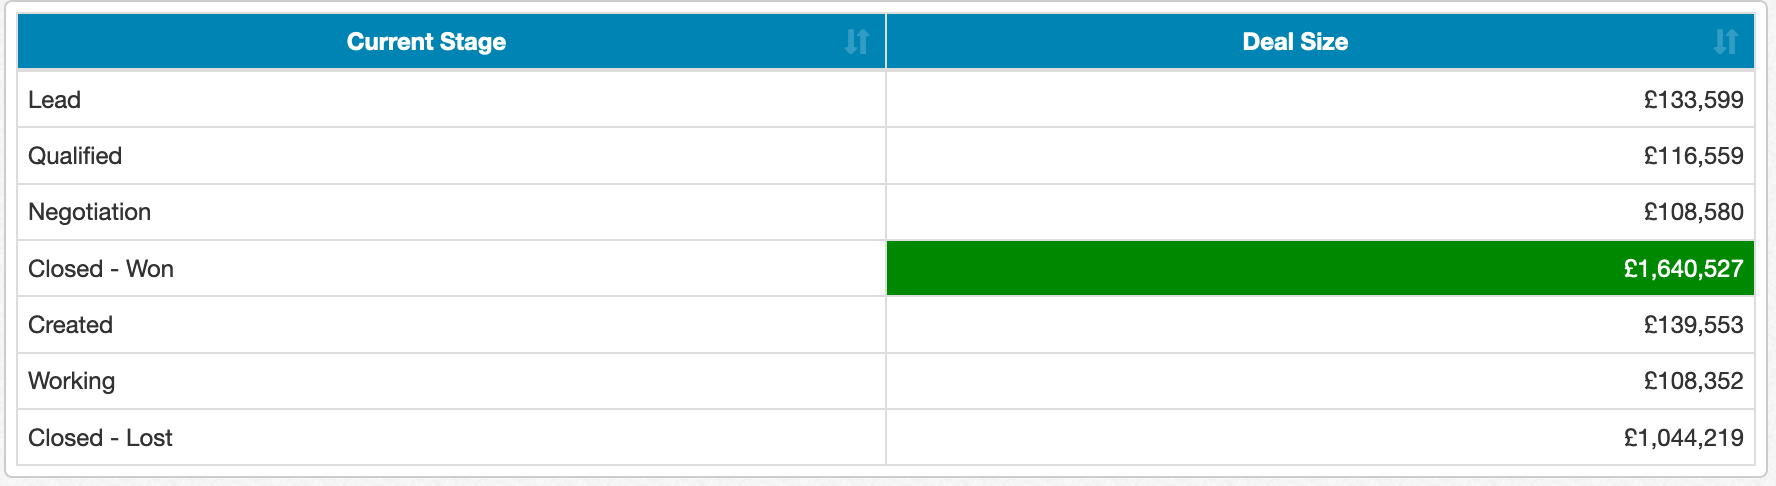
In the above example, the black text on dark green background color makes for poor visual contrast. To fix this, you can add autotextfrombackground() to your conditional formatting expressoin:
if([Current Stage] == 'Closed - Won', backgroundcolor([Deal Size], "#008800"))
autotextfrombackground()
The autotextfrombackground() function automatically changes the text color based on the background color to provide better contrast:
You can also change to text be displayed as bold based on a certain condition:
if([Current Stage] == 'Closed - Won', bold([Deal Size]))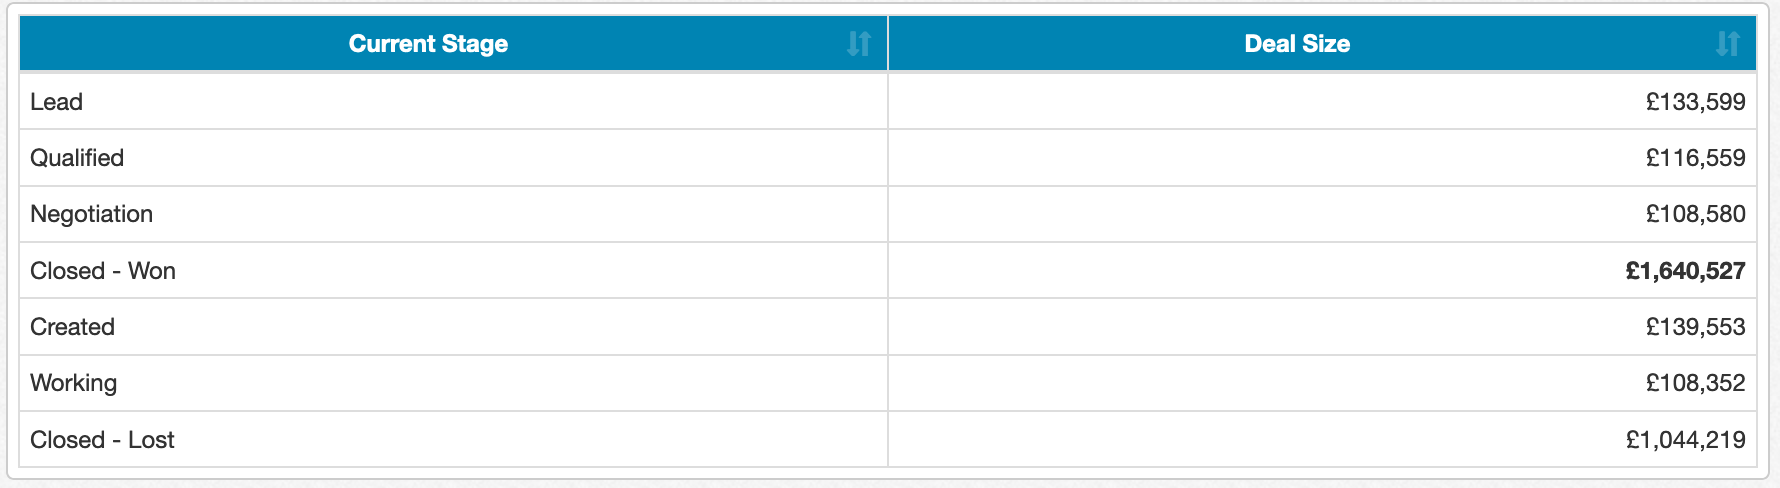
You can highlight the entire row with a certain background color:
if([Current Stage] == 'Closed - Won', backgroundcolorrow("#FFCCCC"))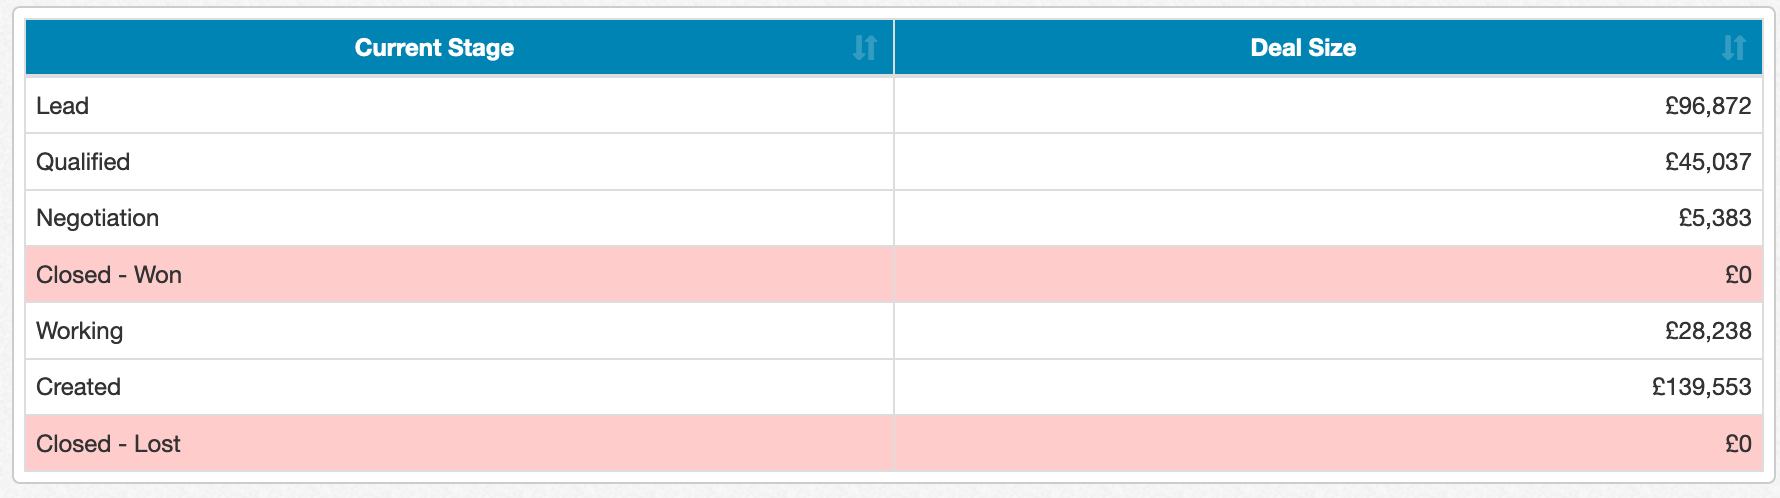
You can display an alternate text value for the cell with list, tree or crosstab reports:
if([Deal Size] == 0, altdisplay([Deal Size], "N/A"))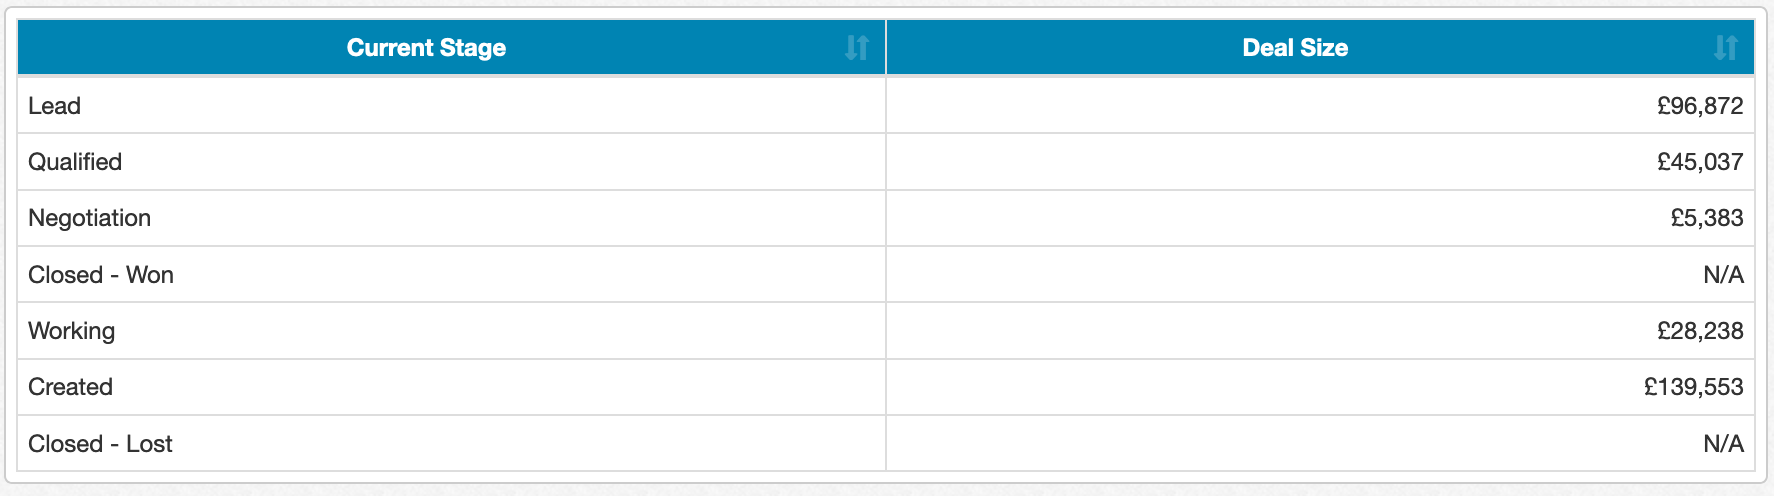
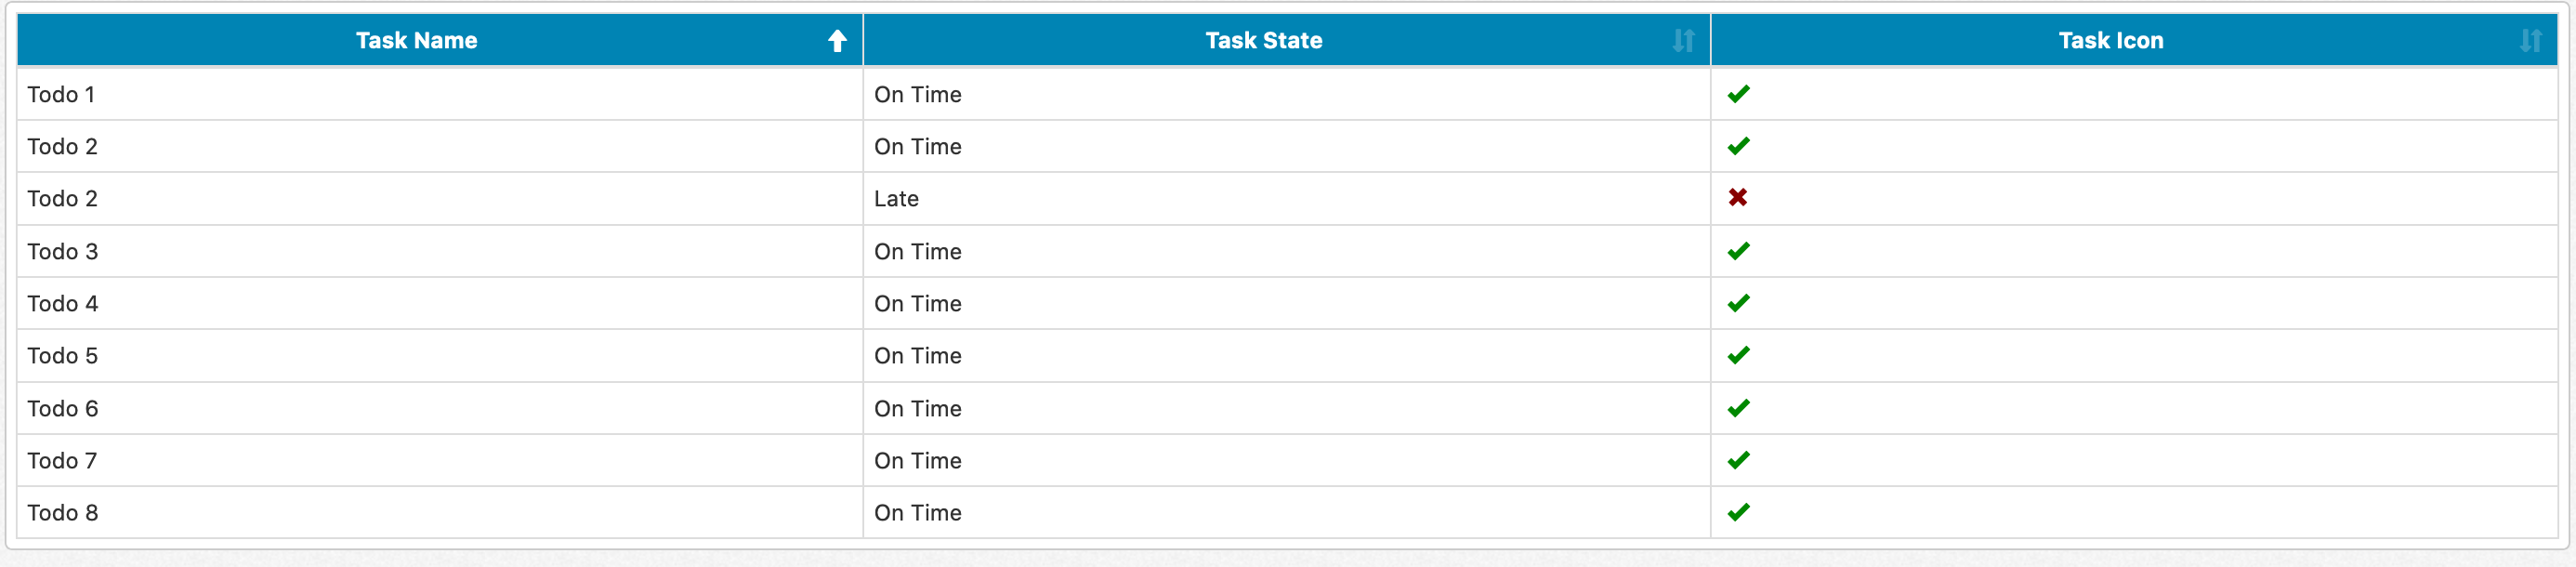
For list reports, you can display icons in place of text. For example, you might want to display a green checkbox in a column if a task is on time, and a red X if it's not. To do so, you could do the following combination:
First, create a field that will render the icon. You can do a simple custom grouping through Custom Field -> Create Custom Grouping with a calculation of stringliteral(""), since we're going to replace its contents with the icon. In this case, we're using a name of Task Icon for the field.
Next, we'll define the conditional formatting for the Task Icon field through Conditional Formatting. The glyph function takes the field and the icon to use. To find an icon name, click on the 'Find Link' glyph in the conditional formatting window:

For example, a checkmark can be found with the name of fas fa-check. We'll add to the conditional formatting as shown:
if ([Task State] == "On Time", glyph([Task Icon], "fas fa-check"))
if ([Task State] == "On Time", colortext([Task Icon], "#008800"))
if ([Task State] == "Late", glyph([Task Icon], "fas fa-check"))
if ([Task State] == "Late", colortext([Task Icon], "#880000"))
The result is a green checkbox for the On Time tasks and a red X for the Late tasks, as shown below:
You can also customize the display to show a progress bar. For example, in the following report, we have Deal Title and Deal Probability:
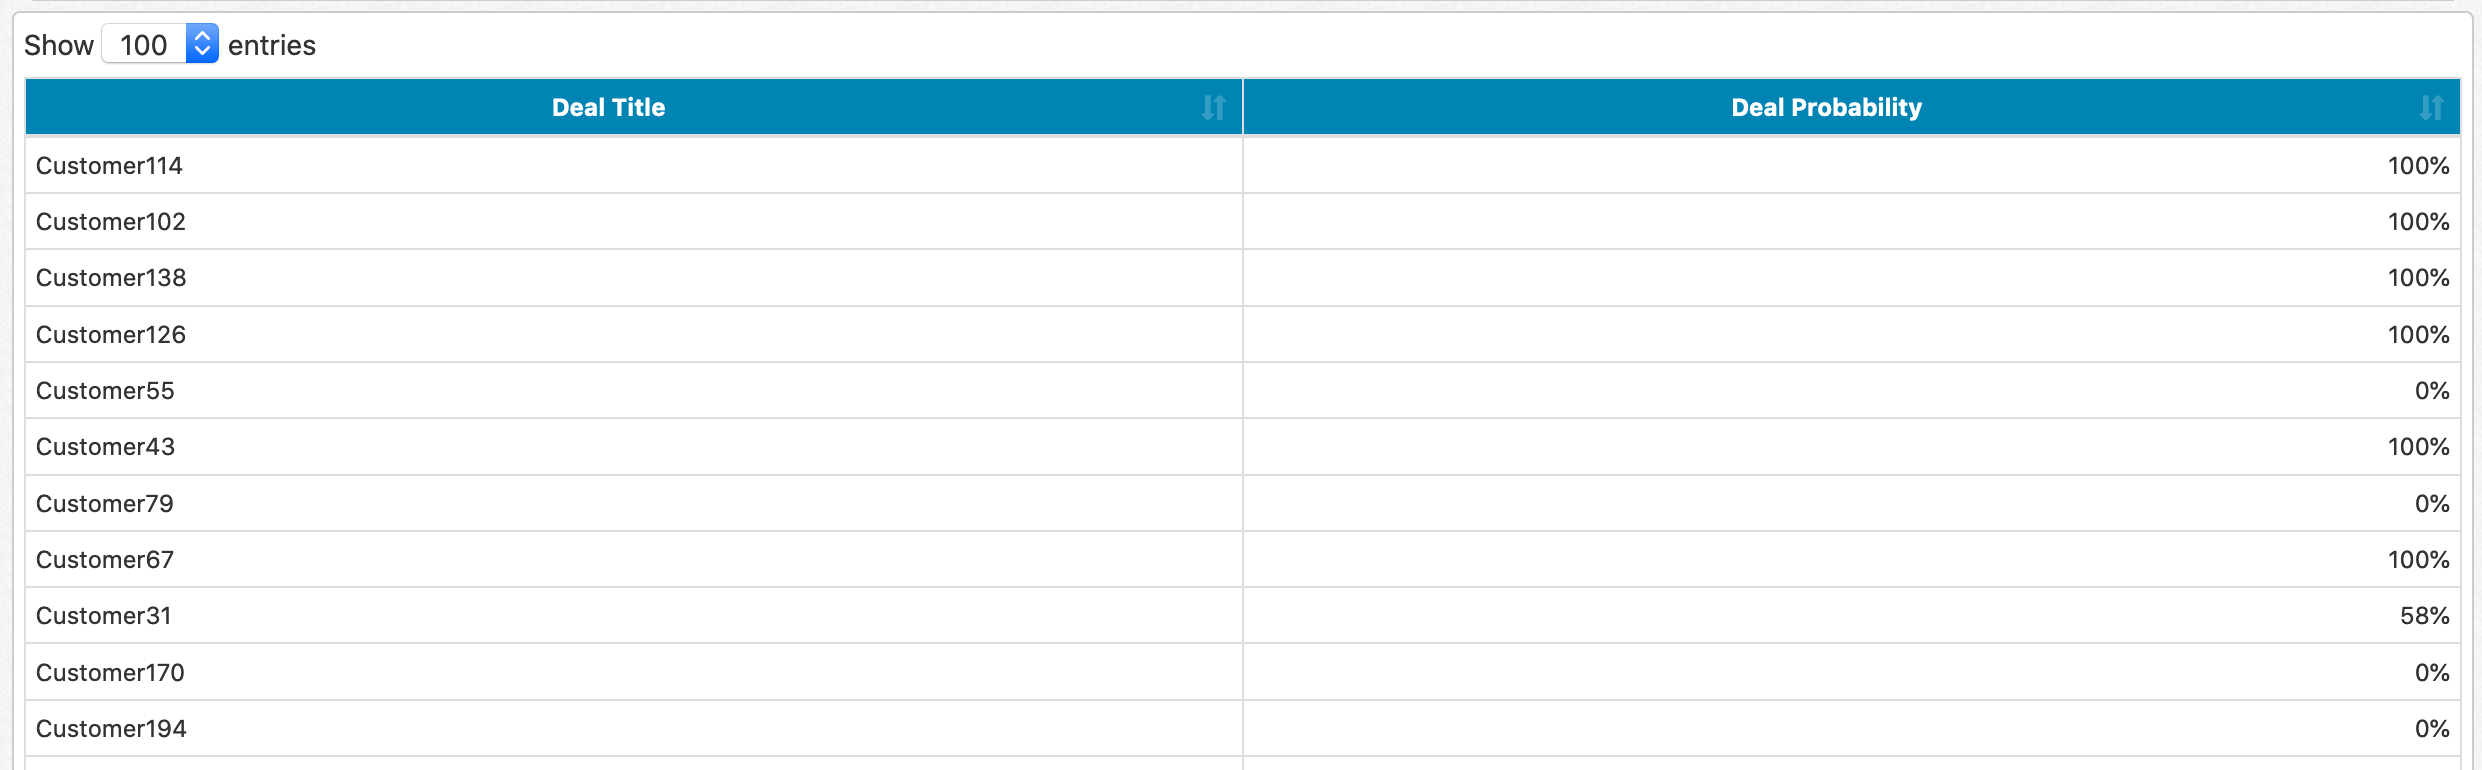
We can render Deal Probability as a progress bar by using the progressbar function in your conditional formatting:
progressbar([Deal Probability])
Which gives us a result of:
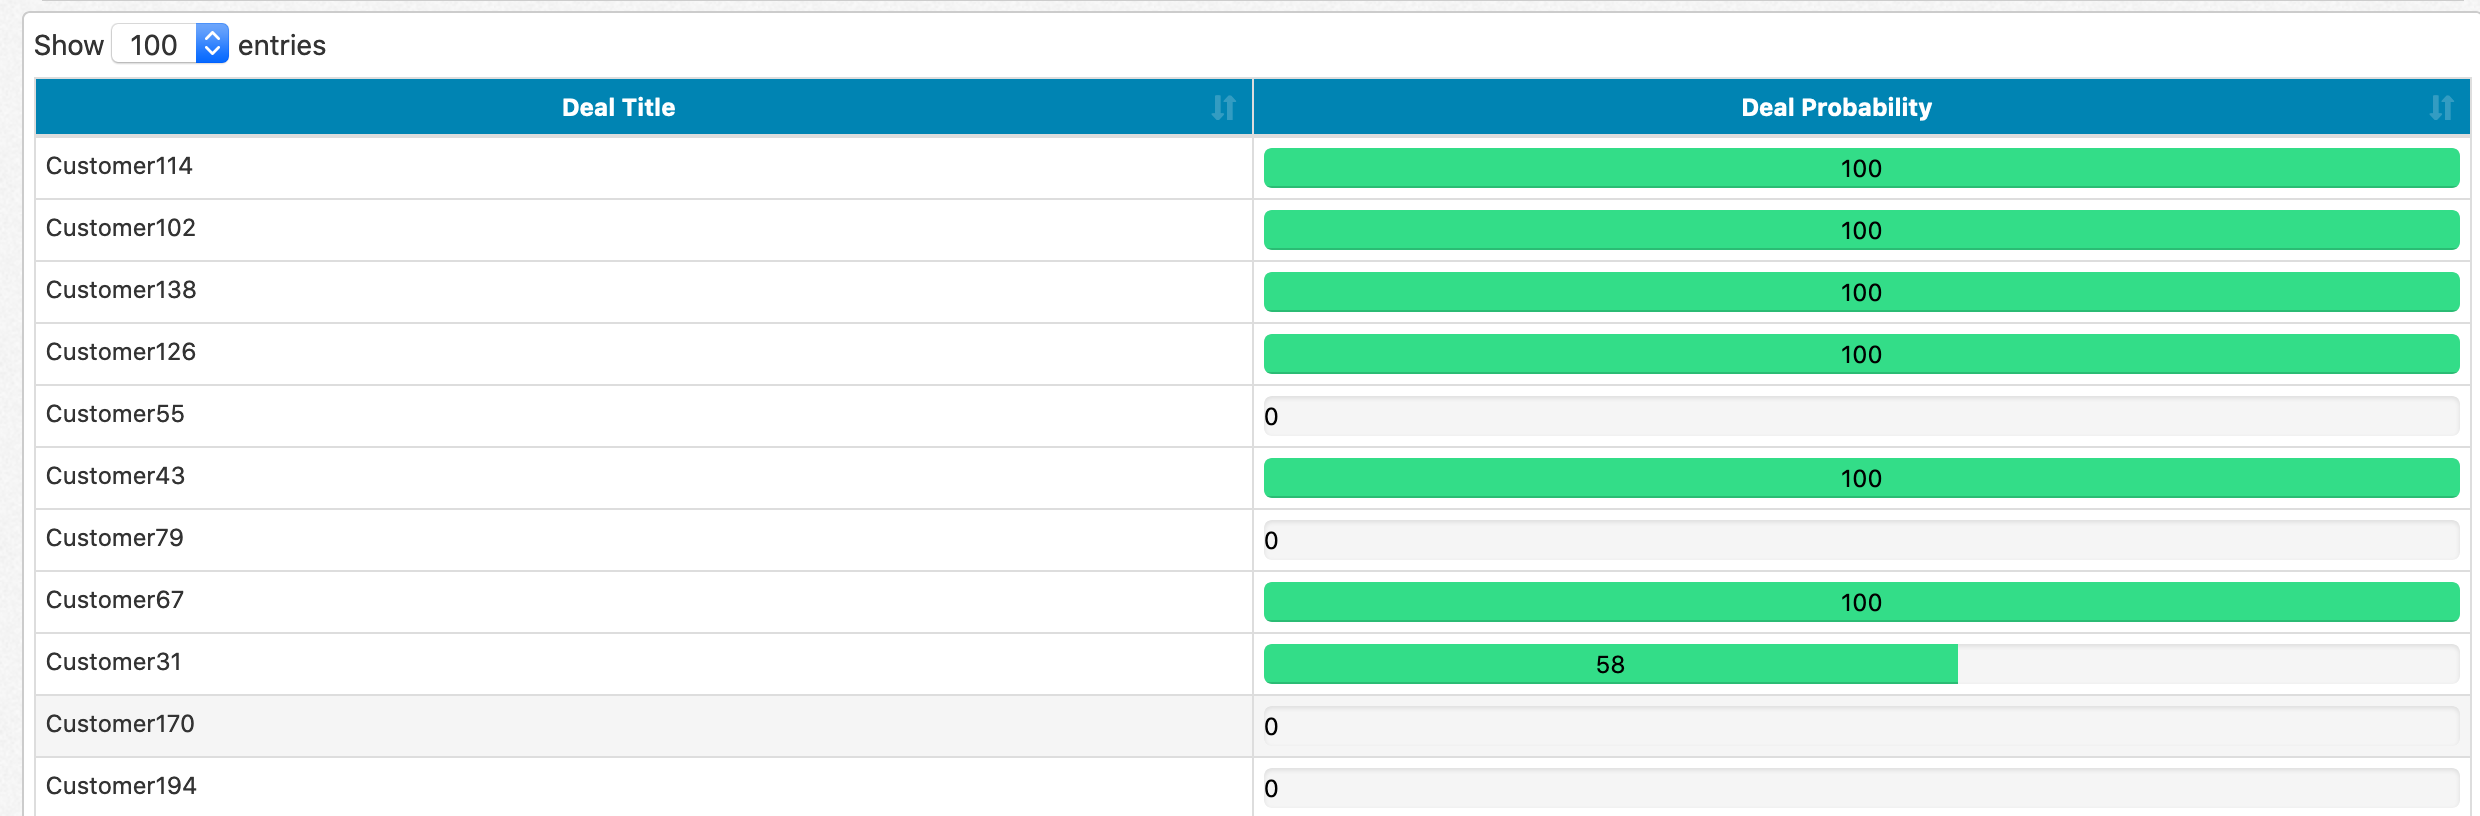
You can configure glyphs and progress bars on list, tree, summary, and form reports.
You can set up table cells on list reports to be buttons:
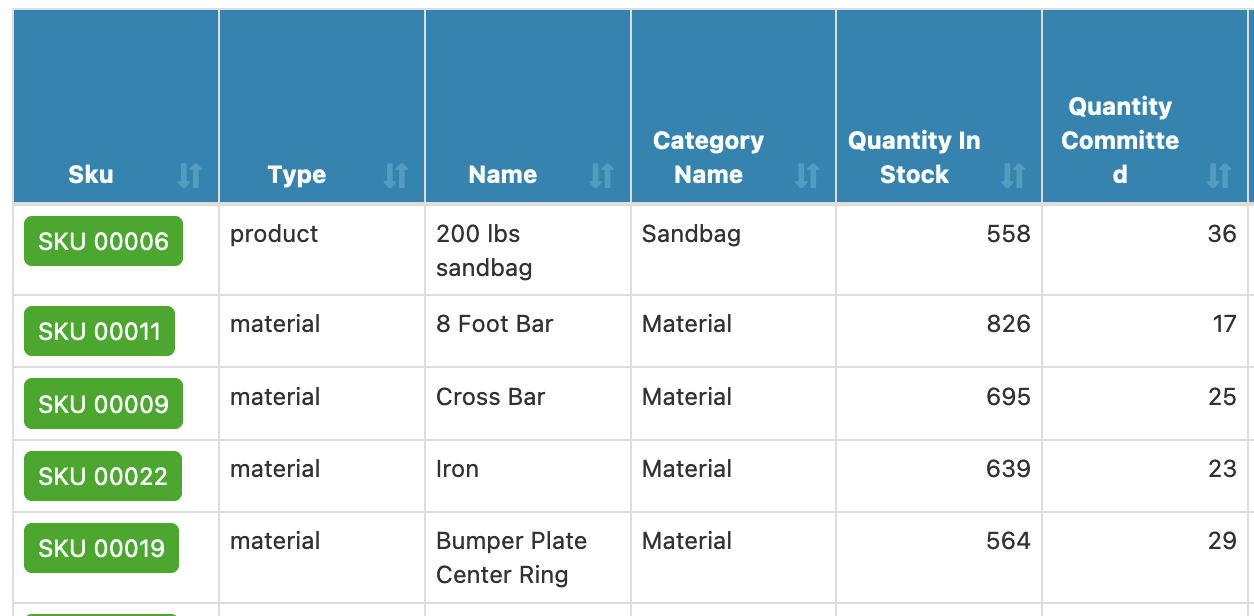
In particular, this can be useful when you're trying to make something obviously a drillthrough to end users. You can configure buttons by passing in the field name, the background color, and the text color:
button([SKU], "#006600", "#FFFFFF")
You can add badges next to your values in table cells on list reports:
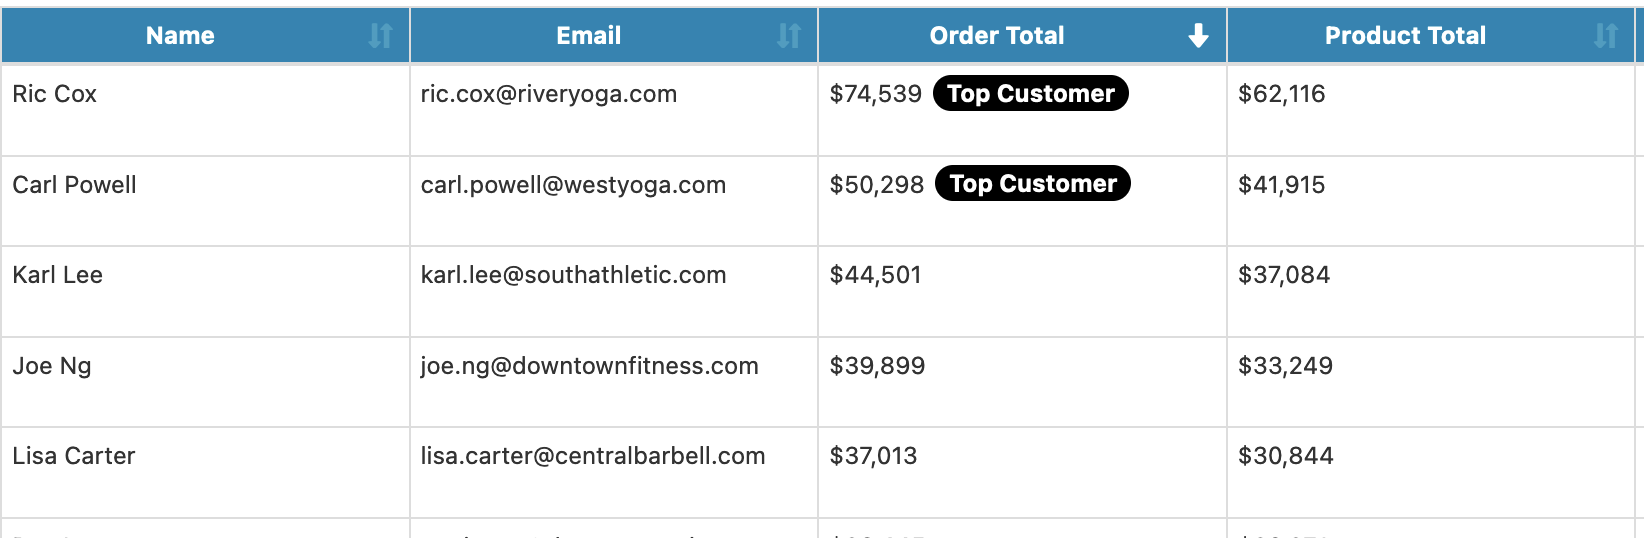
if ([Task Status] == "Overdue", badge([Task Status], "Overdue", "#880000, "#FFFFFF"))
You can dynamically change your field names using conditional formatting. For example, you might have Sales and a Date filter. Using conditional formatting, you can replace the Sales column name in the report with the date range of the Date filter:
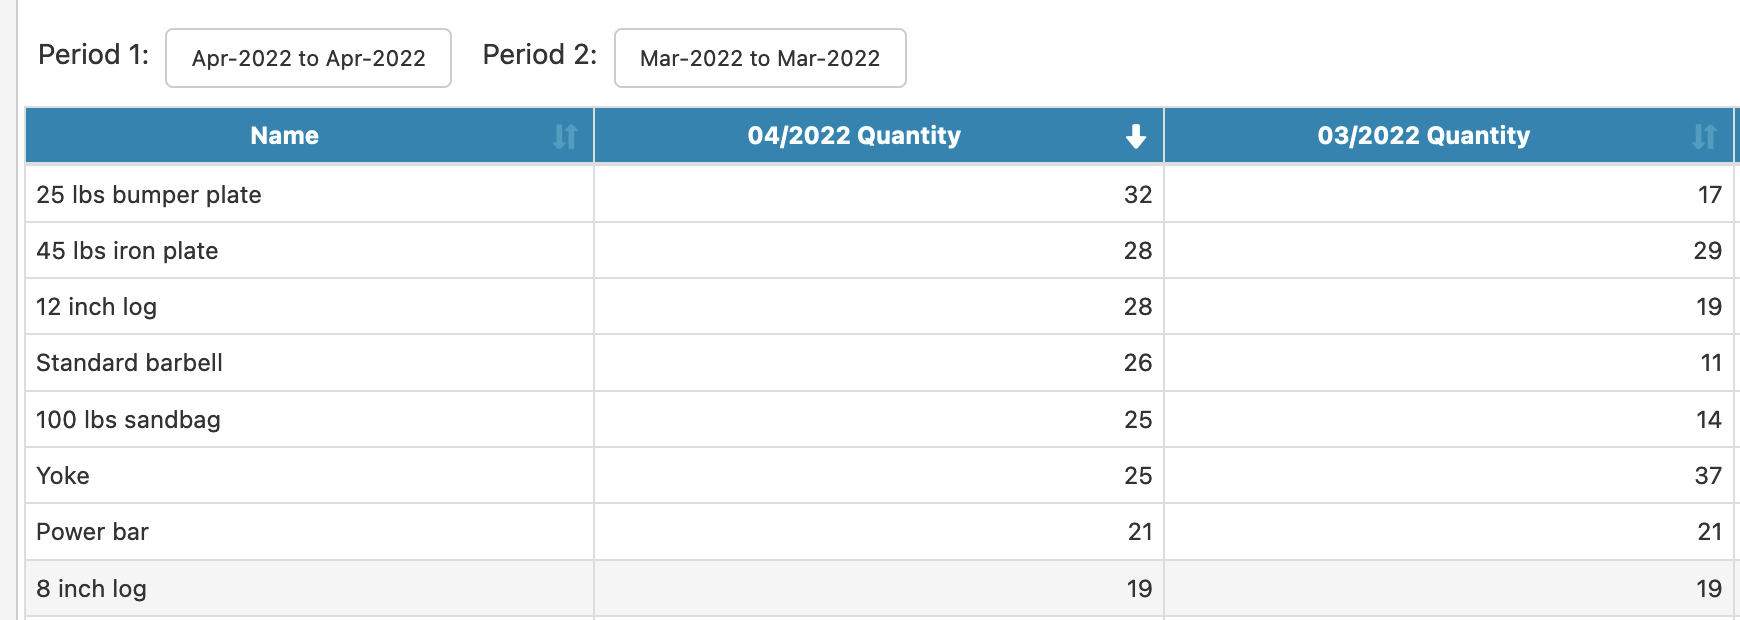
alias([Sales], filterlabel("Date"))
Finally, you can use conditional formatting to change the value itself shown in a report. For example, if you want values of 0 to show as N/A, you could do the following:
if ([Sales] == 0, altdisplay([Sales], "N/A"))