
Filter Basics
- Getting Started with Filters -- learn the basic concepts around filters in Easy Insight
- Grouping Filters -- learn how to build filters like dropdowns, pick lists, and pattern matches
- Date Filters -- learn how to build filters on your dates
- Filter Edit Settings -- learn how to adjust the different settings on filters
- Field Level Filters -- learn how to only apply a filter to one field on a report
- Filter Sets -- learn how to reuse sets of filters across reports
- Segment Filters -- learn how to use segment filters
- Script Filters -- learn how to let viewers apply different scripts to a report
- Field Choice Filters -- learn how to let viewers choose which fields a report displays
- Similarity Filters -- learn how to use similarity filters
Creating Grouping Filters
Creating Date Filters
Filters are what you'll use in reports to slice your data and ensure that you see the right subset of results. Open up the Report Editor for your report. Below the top bar of buttons within both the report and dashboard editor, you'll see an empty area with a "Create Filter" button on the far left side. You can create filters by clicking on that Create Filter button and choosing the field you want to filter by.
Depending on the type of field you select, you'll get a different set of contextual filter options.
Single Value gives you a simple dropdown containing the different values found for the grouping. This option is best for a small number of values.

Multi Value gives you a searchable pick list of values. This option works better with a large number of values. You can also connect multi value filters so that the selection in one will limit what's shown in the pick list of another and you can limit the maximum number of selections.
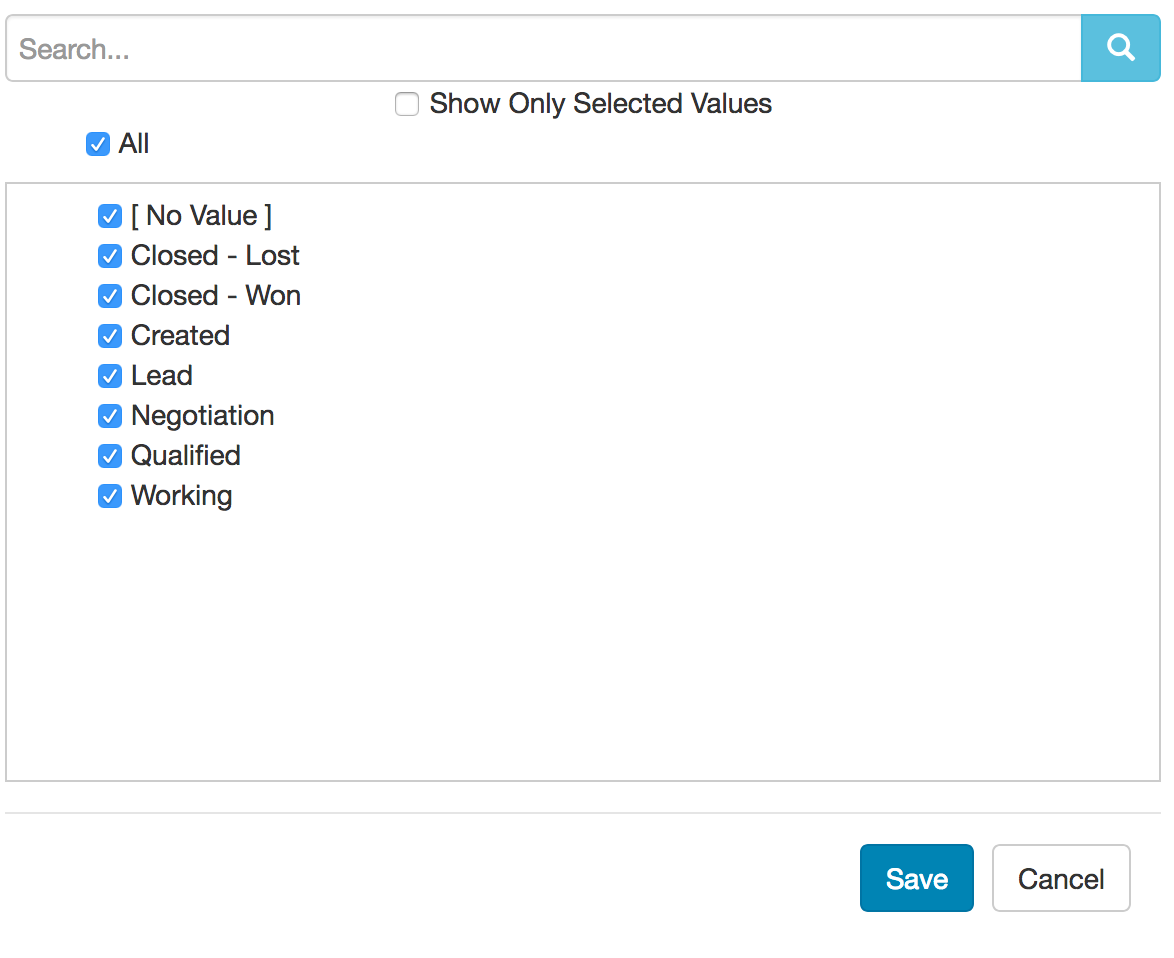
Pattern Match gives you a text input for finding any value containing the selected text. You can control whether or not the text has to be an exact match, whether or not the search is case sensitive, and whether or not the search is a regular expression.

For more information on grouping filters, see Grouping Filters.
If you choose a Date, you'll get the default options of:
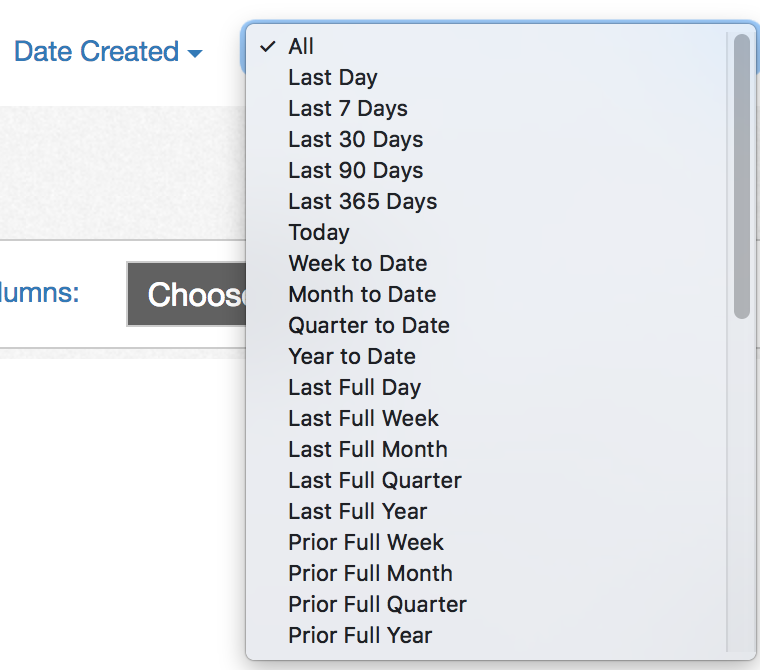
Rolling gives you a simple dropdown containing a variety of rolling time windows such as Last 30 Days, Last Full Quarter, and This Year, as well as allowing you to define custom rolling options such as "Last 2 Full Weeks" or "Next 3 Months".
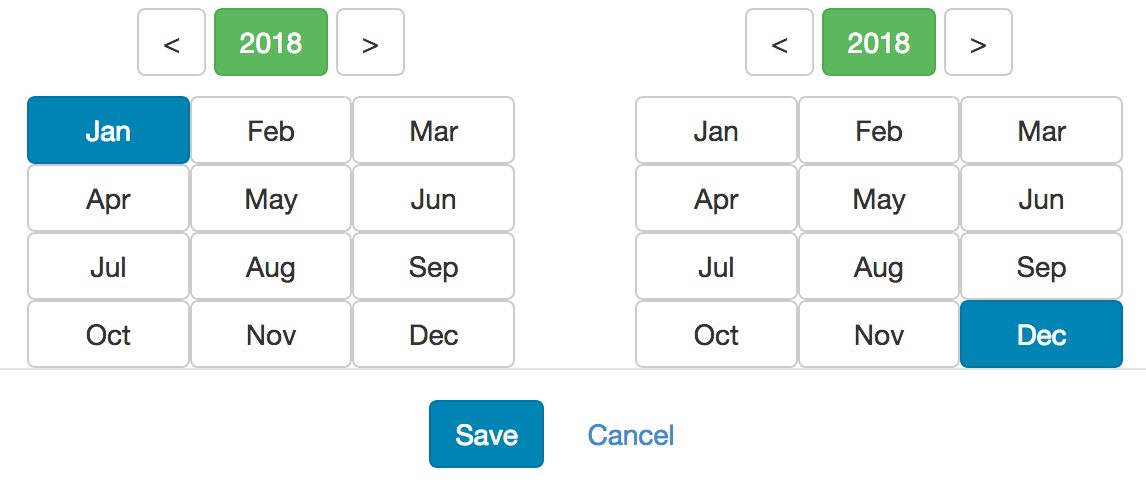
Range first prompts you to choose the interval for the range, with options including Year, Month, and Quarter. For example, choosing Month as the interval gives you the following window for selecting start and end months:
Absolute gives you explicit selections for start day/month/year and end day/month/year. You can configure the filter to only have a start date or to only have an end date as well.

For more information on date filters, see Date Filters.
If you choose a Measure, you'll get a single type of filter which allows you to restrict to anything within a certain numeric range.
In addition to the standard filter types, you can build the following types of advanced filters by clicking on Create Filter and choosing Show Advanced Options:
- Or Filter - a filter containing multiple additional filters, wherein the filter is considered to be true if any of the filters it contains evaluate to true.
- Field Choice Filter - a filter which allows the end viewer to change a particular field of the report. For example, you might have an Interactive Chart where the end user can pick from a sub list of fields to choose the grouping and measure displayed in the report.
- Multiple Field Choice Filter - a filter which allows the end viewer to choose one or many fields from a sub list of fields to be displayed on the report.
If you click on the filter name within the report editor, you can choose Edit Filter to navigate into the filter editor. For more information, see Filter Edit Settings.